
![]()

by el gato malo
cliff notes:
- one must assess full risk/reward to accurately gauge a medical intervention
- this bar is especially high for vaccines given to the healthy
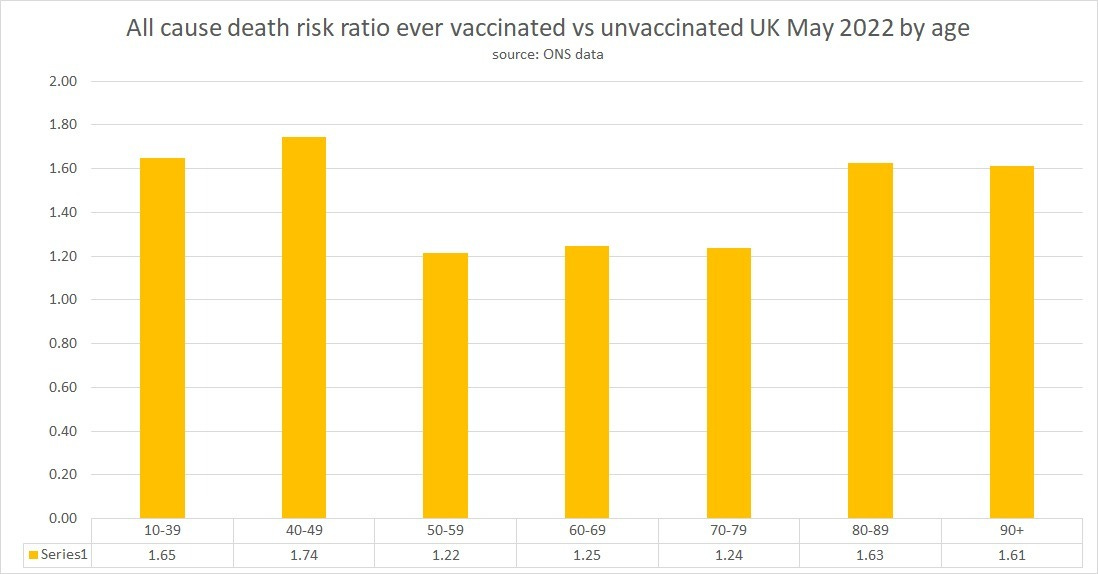
- by may 2022 having ever taken a covid vaxx was associated with 22-74% greater all cause mortality vs being unvaccinated and this was true in ALL age stratifications.
- risk rates were still rising when publication of this data series was discontinued and could well be higher now
- some benefit against “death by covid” was still in evidence but was rapidly diminishing and was clearly either being miscounted or swamped by some other form of mortality.
- this implies deeply negative overall risk/reward from covid vaccines and raises pointed questions about their continued promotion and the processes by which they were approved. there was no age group in which they were associated with overall mortality benefit.
ok, let’s dig in
medicine is everywhere and always a cost benefit equation.
there is no other framing and there are no free lunches.
everything, even highly benign health undertakings like exercise have trade offs. these trade offs become critically important in mitigations such as vaccines that are going to be administered widely to healthy people. side effects that might well be acceptable to kill a cancer or delay the onset of diagnosed dementia suddenly look wildly inappropriate when one speaks of prophylaxis. barring some truly outlandish risk experience, pretty much no healthy person takes chemotherapy to try to avoid getting cancer. this is just sensible. it also means that the way we consider our terms and set up the buckets of our bayesian calculations matters a great deal.
you need to be sure you are including everything relevant. 100% effective “shark armor” that prevents all shark attacks but adds a 1 in 100,000 chance of drowning when you swim winds up being a terrible risk reward (over 20:1 against and 600:1 on deaths). none save the most aggressive of shark researchers should even consider it. but the size of the trial it takes to show that at statistical significance is huge. a small or brief study will miss it. it will look safe. to discover otherwise, you need either a huge number of subjects or a long period of time.
this is why it gets vexingly difficult to do vaccine trials on non-decadal scales that are going to be able to capture these trade offs fully or even meaningfully. long tail or long temporal manifestation events are almost impossible to pick up. hell, half the “community safety study” trials for these vaccines are not even due until 2025 and later.
none of the covid vaccine studies were powered for this and that makes these trade offs difficult to assess especially given the iffy and manipulable definitions for “covid death/case/hospitalization/vaxx adverse event/etc,” but there are a few gold standard all inclusive measures that can start to give us a sense of how the overall butcher’s bill is playing out. perhaps chief among these is all cause mortality.
i have oft lamented the lack of availability of this data by vaccination status and age group and opined that if we were only able to find some, we could get to the bottom of the currently elevated levels of all cause deaths being experienced in most of the developed world.
well, i found some. it turns out that the ONS in the UK was, in fact, collecting and publishing this data in raw form through may of 2022 and it is split by 10 year age band.
i have taken issue with much of ONS’s recent methodology around using proxy “age adjustment” and “standard euro age profiles” instead of the actual demographics of the UK and who knows what else in an opaque fashion to make claims that were clearly not only failing to agree with but inverting the published raw data and at this point, i have very low trust in government figures that have been subjected to transforms that are not visible or auditable. but this is real, clean data of all cause deaths by age group split into 2 buckets: ever vaccinated and unvaccinated. it’s exactly what we have been looking for.
so let’s look:
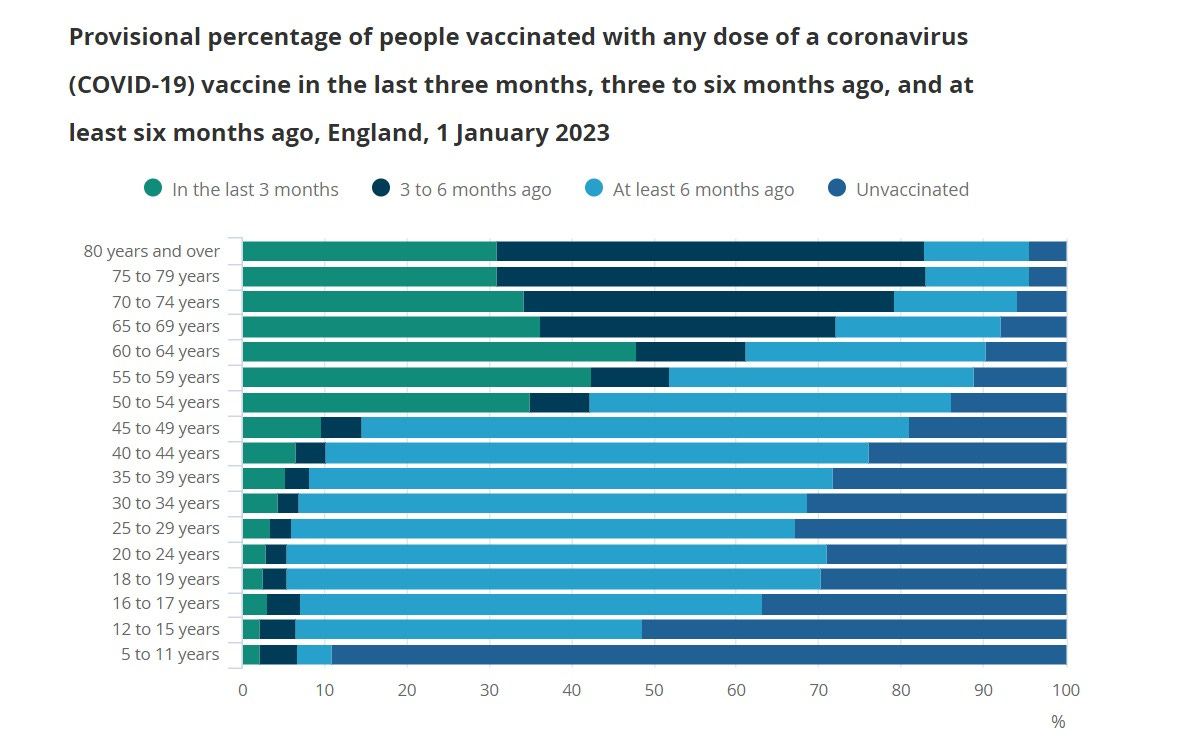
i cross indexed this with another set of UK data on vaccination levels by age that looks like this and had a good count of “unvaccinated.”
this allows us to create a simple “any vaxx vs unvaxxed” measure of VE/risk ratio by simply comparing the % of overall all cause deaths in each group. the measure of vaccination rate is from 18 dec 2022 (the graphic updated post my downloading the data but is basically the same) and thus might be slightly favoring vaccine efficacy but as only about 3 percentage points of people in the UK got their first vaxx in 2022 (and less than 1% from may to dec) and mostly were likely young it’s probably having little effect apart from maybe in the 10-39 bucket which, i would caution, is less trustworthy than the others as the composite of vaccination rates was wide and complex and injects increased estimation error.
i did not go back further because the variance in vaxx rates from the data i had would have started to widen excessively and i have not found a temporal series to use to handle that yet. (if anyone has one, please let me know)
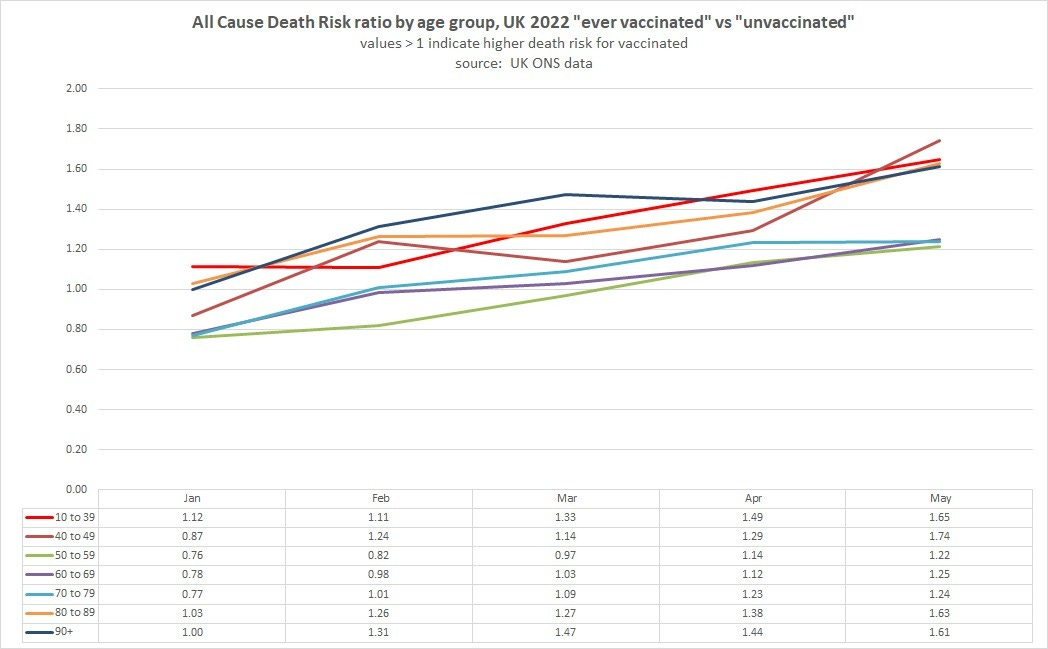
this is easier to see graphically and so i plotted it below.
risk ratio is the rate of per capita all cause death for the vaccinated vs the unvaxxed. (vaxxed deaths per capita/unvaxxed deaths per capita) numbers below 1 show vaccine efficacy on overall death. numbers greater than one show the vaccinated dying in greater numbers.
as can be seen, this does not look good for the vaccines. RR’s are >1 and rising through may when this series (like so many others that started showing numbers that refuted the UK health authority narrative) was discontinued.
based on this data, there was a time early in the year when perhaps some groups were seeing some all cause mortality benefit (though this could also be greater undercount of the unvaxxed skewing the figure) but by march no one was materially benefitting and most looked to be worse off. by may, all were worse off, some quite widely so. a 1.6 or 1.7 risk ratio is no joke. that’s a 60-70% elevation in death rate vs control group.
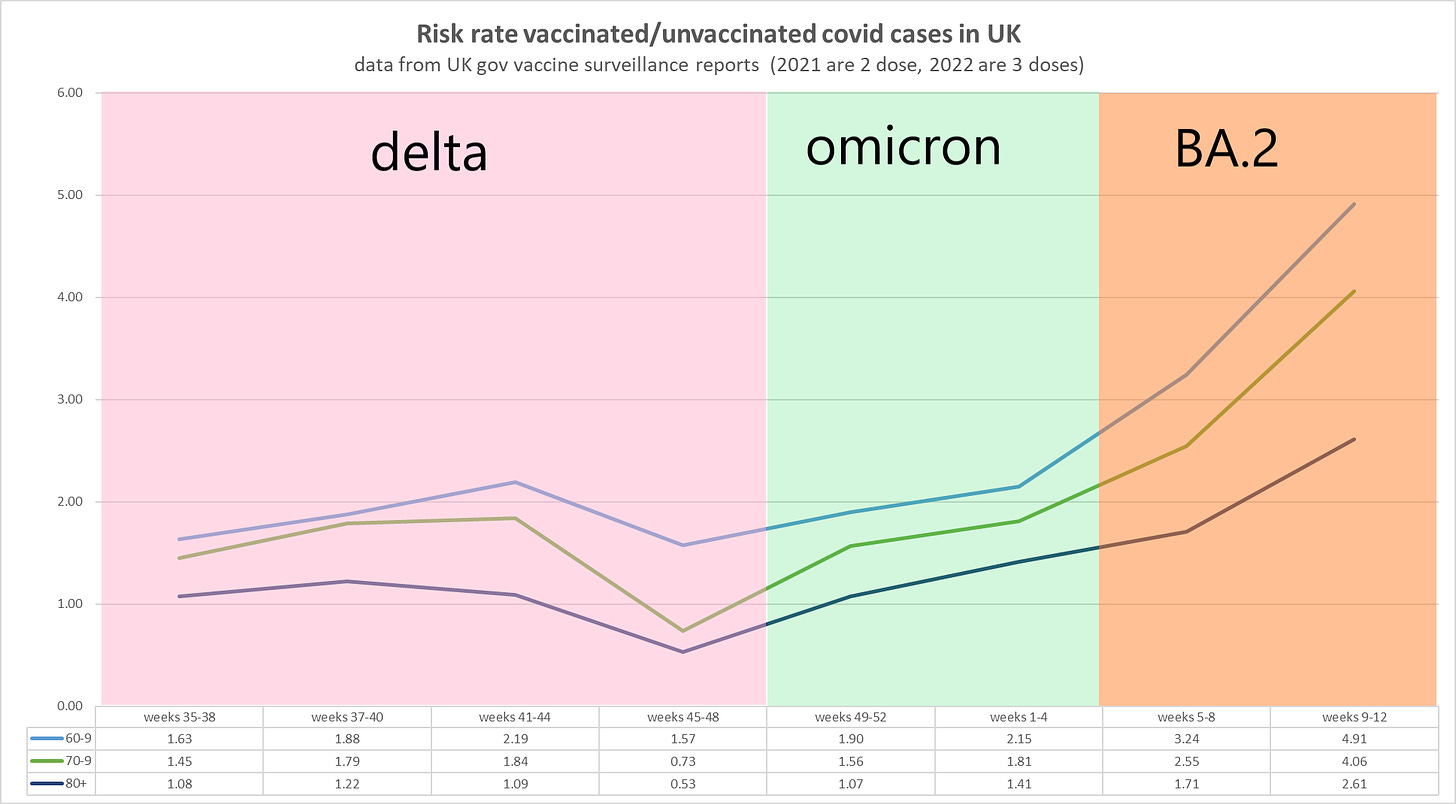
where these rates are now is a useful question that i unfortunately lack the data to answer but the trend seemed to be intensifying as new variants emerged and looked to be expressing vaccine advantaged behavior as one can see here from the cases risk ratio where relative infection rates were exploding in march (just where the ACD RR’s broke over 1 as BA.2 looked to change the game) when this series was discontinued. (more data on this and methodology/sourcing HERE)
there is some interesting age stratification as well.
it seems, for whatever reason, to be worse in the young and the old and somewhat less problematic for those in the 50-79 band. this could be more intense response and AE to vaccine in the young and less ability to use a more generalized immune response to overcome antigenic fixation in the old, and that fits the other data, but i’m starting to go out on a limb and speculating there, so let’s climb back in and stick to the data in front of us because there are some further wrinkles worth exploring.
this same dataset also tracks “covid deaths” using the same “ever vaxxed” vs “never vaxxed” buckets. it also shows an interesting story.

At least at the Q&A about Hamlin today, the medical personnel said the cause of his cardiac arrest was still unknown, as in they were not ruling out myocarditis.
They just want to reduce the Human Population over the false idea of overpopulation as claimed by that crack-pot Paul Ehrlich