
![]()
Ed Caryl:
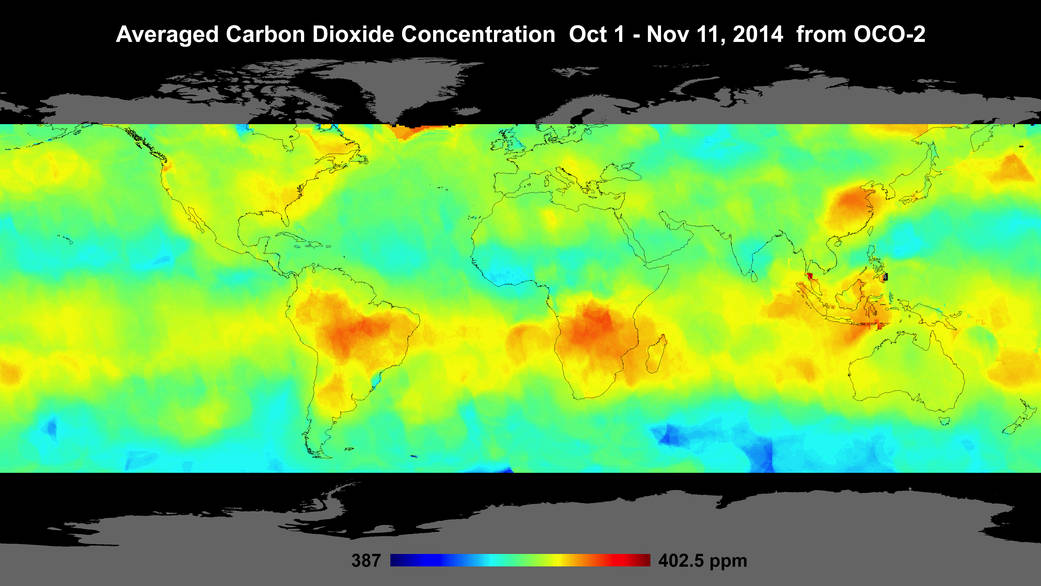
On 1 July 2014, NASA launched OCO-2, the second attempt at orbiting a global carbon dioxide observatory. In December, the first global map was released.
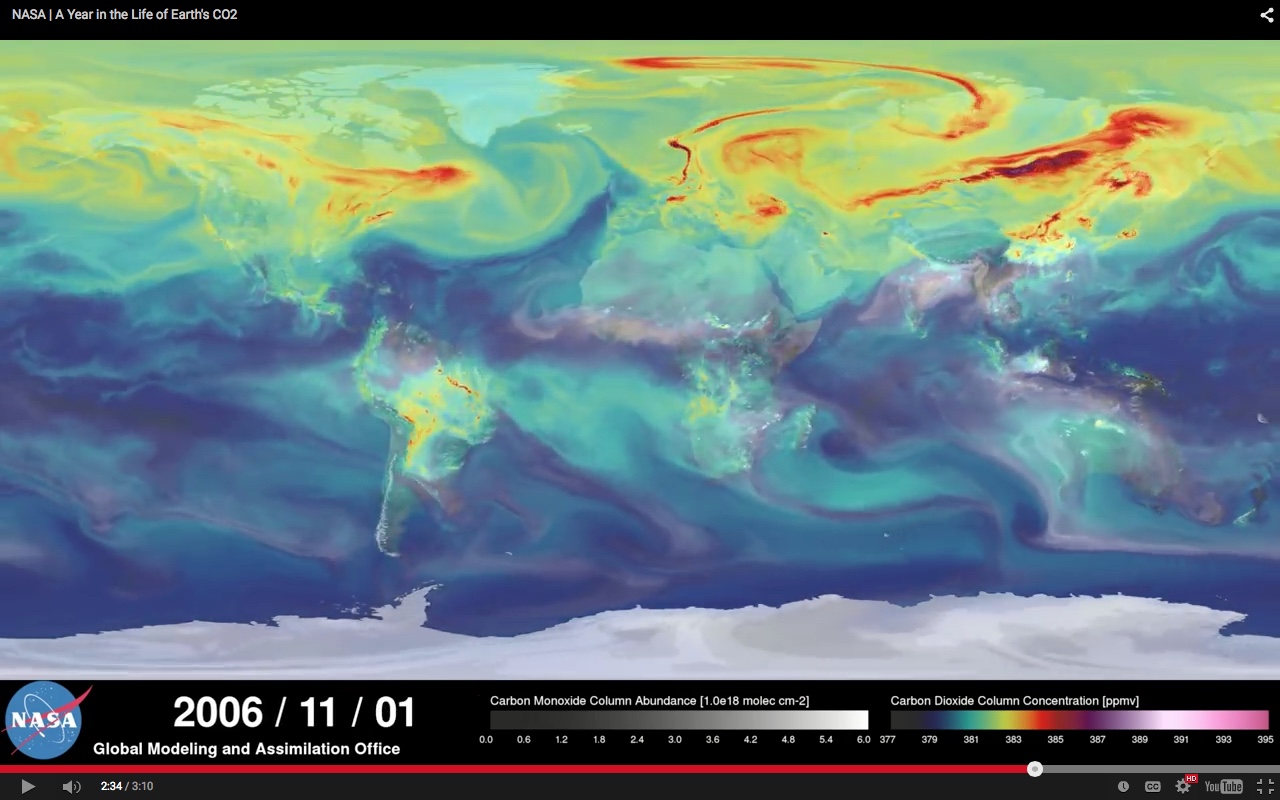
Compare this map with a frame from a previously released video showing a model of what the CO2 distribution was thought to be for roughly the same time period in 2006, the 1st of November.
Note the differences. There is much more CO2 coming from the tropical rainforests than the model predicts, and there is a sink, where CO2 is taken up, over Russia that the model does not have.
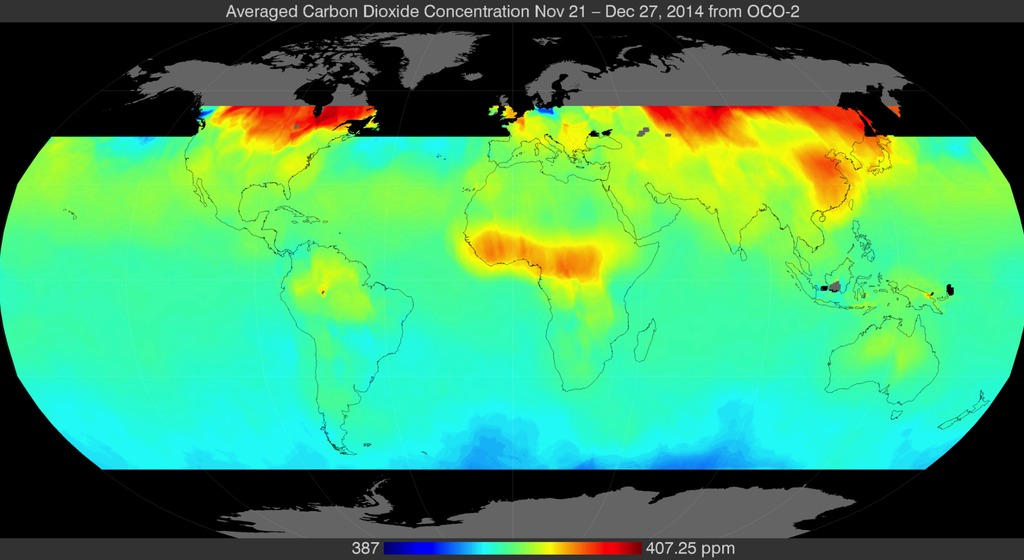
Since January, there has been no public disclosure of any further maps from OCO-2 on the OCO-2 website, except for a slide (their figure 5, shown below) from a webinar presentation that took place in February. This covers the period from late November to late December.
Compare this with a corresponding frame from the model video.

Wait…are you showing us actual evidence that the preconceived computer climate model simulations are…….WRONG?
But….what does that say about the alleged 97% consensus about AGW?
Oh my stars and garters….how could a 97% consensus be wrong?
Heaven forfend!
When Al Gore, Bill Nye ,”the science guy”, and President 44 states: the science is settled, something is wrong with those computer models. Besides everyone knows that Republicans are anti science and climate change deniers should be hunted down for the safety of the planet.
The FACT that no models or predictions EVER match actual measurements and events PROVES AGW… or something like that.