
![]()

by Zero Hedge
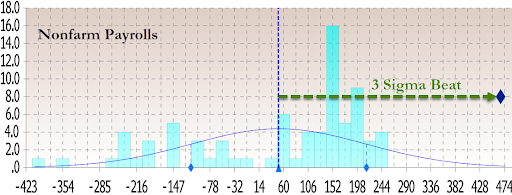
For those who only look at headlines, today’s payrolls report was a veritable shock: coming in at 467K, it was almost 4x the consensus median expectation of 125K, and was orders of magnitude above Goldman’s forecast of -250K. Putting the stunning, 3-sigma beat in context, it came above all 78 estimates, and was more than double the highest forecast of 225K from HSBC. Even more ludicrous were historical adjustments which saw December increased from 199K to 510K, November from 249K to 647K and so on.
How is that possible?
After all even CNBC – while interviewing labor secretary Marty Walsh – couldn’t believe the BLS data, prompting the secretary to repeat on many occasions that the numbers are “credible” and he “stands behind them” and of course he will: after all, taken at face value the numbers signal a resilient labor market and demand for workers despite omicron’s hit. The gains were broad-based, spanning retail, hospitality, transportation and warehousing, business services and others. In short, contrary to data from even the Atlanta Fed whose GDPNow shows Q1 GDP rising just 0.1%, the labor data indicates an economy firing on all cylinders and growing strong.
But is that true?
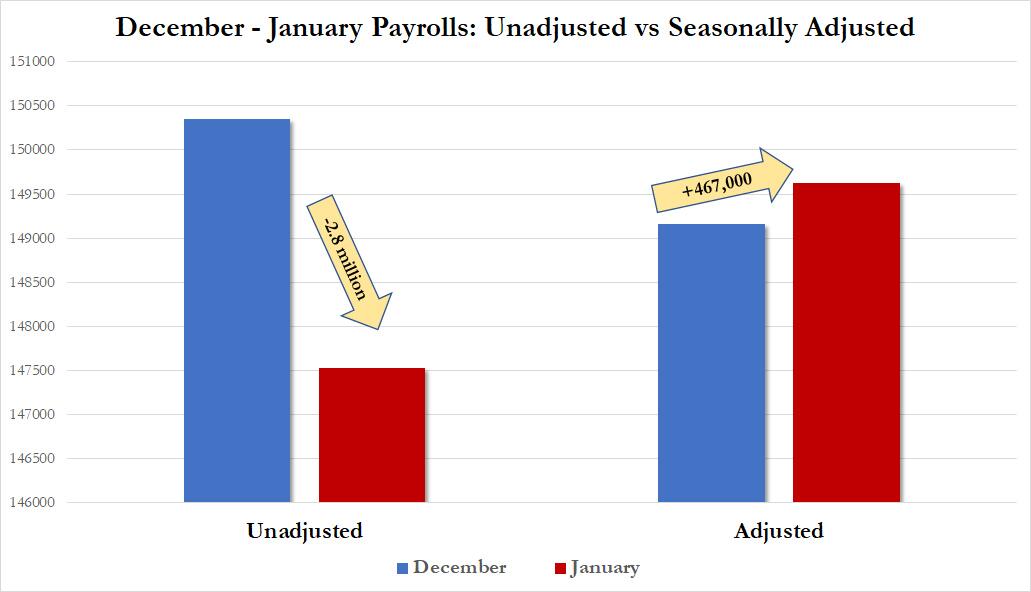
Well, here’s what happened. First, looking at just the December to January change we find that while the seasonally adjusted number rose by an impressive 467K, the unadjusted number collapsed, tumbling from 150.349 million to 147.525 million, a 2.8 million drop (as it tends to do every time the year shifts from December to January) meaning that the entire delta in the January number – somewhere in the 3+ million range – is due to arbitrary adjustments overlaid on top of the data.
The plot thickens, and indeed one thing that analysts apparently forgot when they were submitting their forecasts for January’s payrolls is that this is the month when the BLS adjusts data for the past 10 years as part of its population estimates revisions, which impact both the Household and more important, Establishment, surveys.
In summary, what these revisions did was to revise 2017 job growth lower by by -61,000, 2018 lower by -26,000, 2019 revised lower by -43,000, while 2020 was revised higher by 124,000, and 2021 was also revised up 217,000, or in total a 211,000 upward revision over 5 years or 3,500 jobs per month.
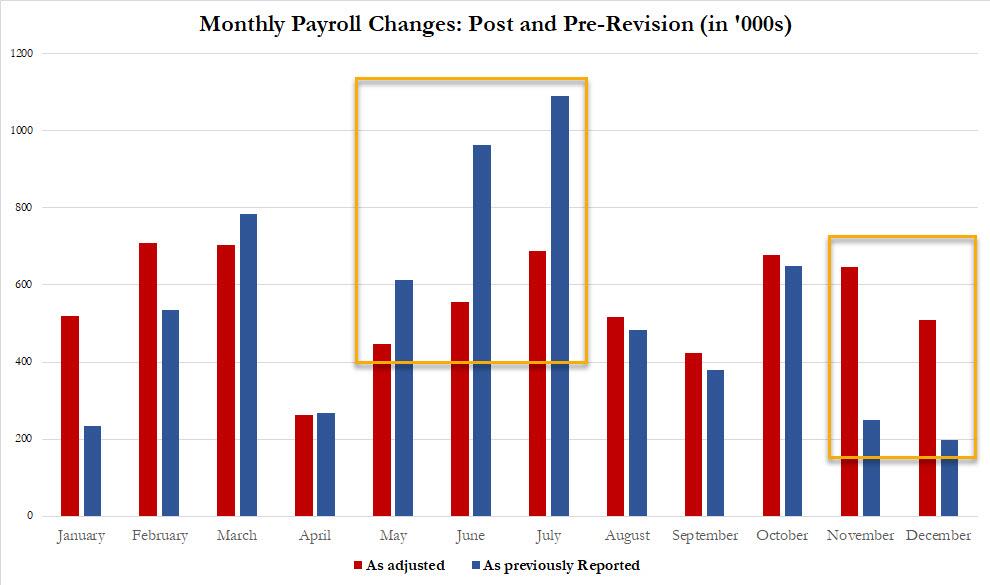
Focusing on just 2021, we find something curious: the stunning print from the summer which saw June and July print at or over 1 million, have been slashed by almost 50%, at the expense of most recent months such that October added 29K, November added 398K and December added 311K jobs to what was the original print only as a result of seasonal adjustments. Said otherwise, March-July was revised lower by -1,061,000 while Aug-Dec was revised up by +817,000.
At this point the answer what is behind the massive January beat should be becoming clear: how did a -2.8 million actual drop in jobs translate into an adjusted 467K? If you said seasonal, covid and population control adjustments, you are right. And to be sure, this is something both we and others flagged, when we lamented that month after month, the BLS appeared to be using stale seasonal adjustments.
But digging deeper shows that this was not just an ordinary seasonal adjustment.
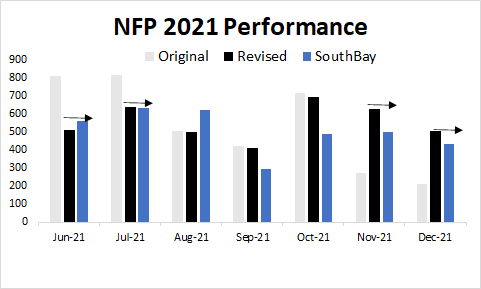
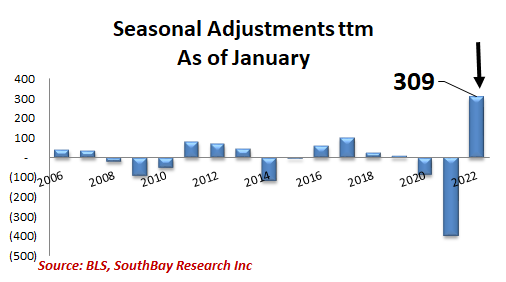
As SouthBay Research notes in his NFP postmortem, “there has never been a January Seasonal Adjustment of this magnitude” and visually:
If only normalizes the January seasonal adjustment, the payrolls number is some 309K lower, or ends up being 166K, right on top of expectations.
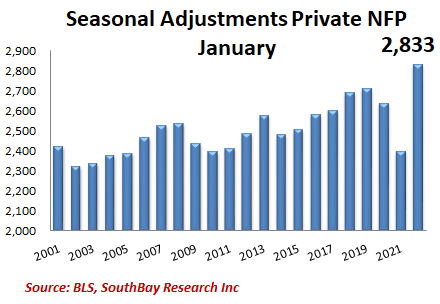
The seasonal adjustment for Private payrolls was even more ridiculous:
Where it gets even more bizarre, is that as SouthBay notes, January’s Private NFP (NSA) of -2391K was almost exactly the 10-year and 20-year median 2384K. So why the BLS is applying such a grotesque seasonal adjustment to it, is unclear (actually, if one assumes that the Biden admin tapped the BLS secretary on the shoulder, then it is very clear).
It’s not just outside analysts who reach this conclusion: in Table C to its report, the BLS showed “December 2021-January 2022 changes in selected labor force measures, with adjustments for population control effects” and confirmed that if one had used an apples-to-apples basis for the January numbers, the number of Employed workers (from the Household Survey) would be down -272K. Instead, thanks to the population control effect adjustment of 1.471 million, the final number was 1.199 million!

The numbers presented yesterday for January jobs are as fake as was the 4th quarter GDP of 6.9%. Statistical and economic analysts have been able to peel the bark from the tree to see the tree is infested with insects.
The biden junta is desperate and it shows. They are lying to the American people. And, future repotting now has a skewed baseline putting the junta into a position of continuing to lie or own up to their deception.
Either way, they have put themselves into a box.
This link works better:
https://www.zerohedge.com/markets/here-whats-behind-todays-stunning-payrolls-beat
Just like everything else coming out of this regime and the deep state, the economic data can’t be trusted. Everything about the left is based on lies because their entire ideology is failure.
Perhaps we’ll be at war with Russia when the figures get corrected so no one will notice. A couple of days ago, the regime was making excuses for the inevitable reports of poor performance. When the surprising (and bogus) “actual” data was reported, they acted like it was their plan all along. What a joke. An obscene joke.
Thanks… will fix the link
Another lie from the transparent Biden administration. Are they blaming Trump?