
![]()
P.Gosselin:
Fellow New Englander, engineering physicist and energy expert, Mike Brakey has sent me a summary analysis of NOAA past temperature “adjustments” for Lewiston-Auburn, Maine.
=====================================Black Swan Climate Theory
By Mike BrakeyHere in the U.S. I have documented manipulations similar to those in Switzerland and other locations worldwide that NTZ wrote about yesterday.
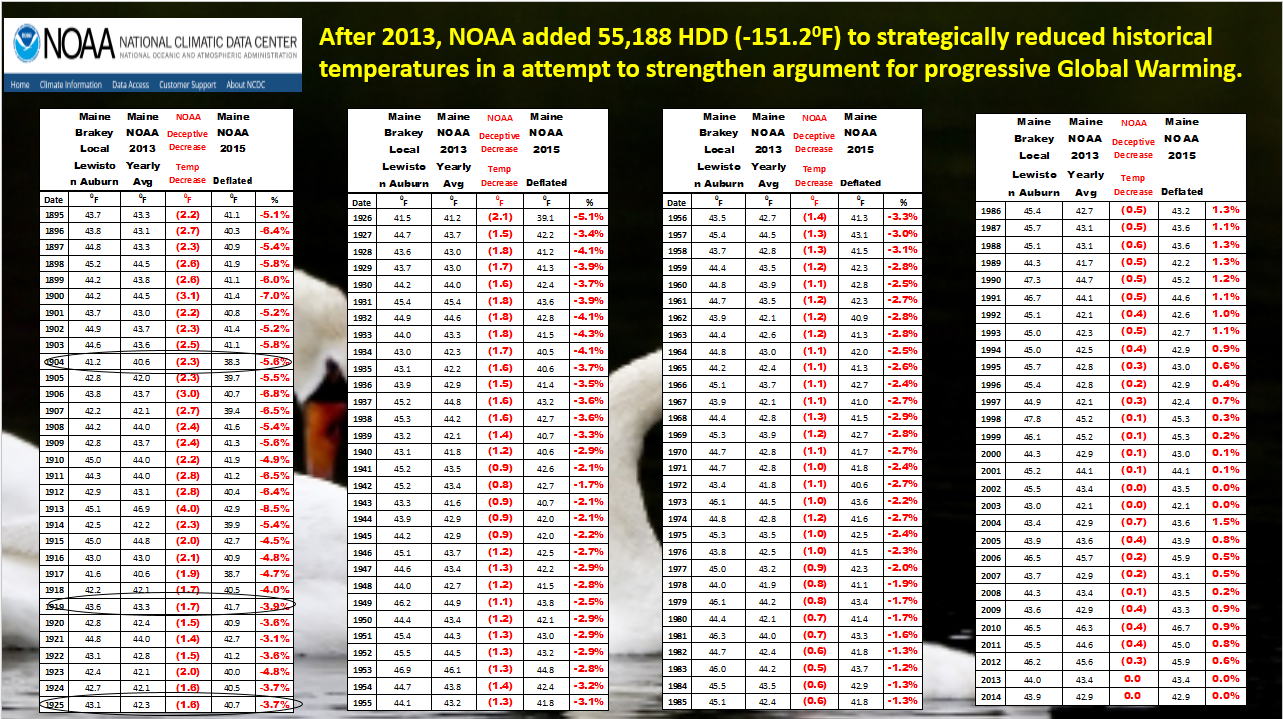
Over the last months I have discovered that between 2013 and 2015 some government bureaucrats have rewritten Maine climate history between 2013 and 2015 (and New England’s and of the U.S.). This statement is not based on my opinion, but on facts drawn from NOAA 2013 climate data vs NOAA 2015 climate data after when they re-wrote it.
We need only compare the data. They cooked their own books (see numbers below).
NOAA cooled the years of Lewiston-Auburn Maine’s past by an accumulated 151°F! (55,188 heating degree day units).
The last four months have been some of the coldest you might ever recall in our lifetime. So far 2015 is the fourth coldest in Maine’s history over the last 120 years. Data from 2013 confirm that so far – from January 1 to April 29 – 2015 has required 4249 heating degree days.
That rivals 1904, 1918 and 1923 over the last 120 years.
But when I recently looked at NOAA’s revised 2015 data, these last four months now would not even put us in the top twenty of coldest months. The federal government went into the historical data and lowered those earlier years – and other years in the earlier decades – so that they can keep spending $27 billion a year on pushing global warming.
They assumed no one would archive temperature data. But I did. My research indicated they used the same algorithm across the United States at the same time. Fortunately I had archived their data from 2013 for Maine and recently compared it to their 2015 data (see above table).
As an engineering physicist and heat transfer specialist, I have worked with heating and cooling degree days for forty years. It is alarming when one discovers multi-million dollar websites have been corrupted with bogus data because the facts do not match up with agendas.
It tremendously harms the industry you and I both work in. Worse, it harms the public. If the public knew the climate data facts indicated it was not getting warmer locally, and that it might actually be getting cooler, it would have all the more reason to insulate and become more energy-efficient in their homes.
I have put together a Maine history of climate temperatures in a narrated PowerPoint Presentation placed on YouTube titled, Black Swan Climate Theory.
Below is a brief sampling of my findings:

How much more data falsification from the AGW cultists has to be shown before this leftist lie is tossed out with the rest of the garbage?
Liberals lie. It is simply what they do.
The main difference between Classical History and Revisionist History is that CH edits via adding footnotes and bibliography, adjustments made based on new information and all changes from past editions noted.
RH simply puts out a new edition that might be completely different from the older one, with NO reasons given or changes noted.
RH erases history for the purpose of an agenda.
Up until this generation the Scientific Method was the CH of science.
A new theory had to be proven via that method.
Peer review had to be open to all comers.
Then phony peer review took over, who covered up flaws because they shared an agenda with the flawed research.
Finally we moved away from the SM completely, rationalizing that ”the facts were already in,” the ”time for debate is over,” etc.
There was a Sunday Funny last week with Obama drawing numbers and computations on a chalkboard. The scientist asks him the basis of his figures. He pulls out an EPA mystery rule book.
That’s about it.
It is called the fallacy of the appeal to authority.
Absolutely amazing. Economic data, climate data, you name it and they fudge it to enhance their socialist/neo-Marxist agenda. Vlad and Joe would proud.
@another vet: It is relatively easy for liberals to revise history nowadays because, with the corrupt media in their pocket, there is very little chance of being called out for their lies.
Global Warming? Low Sun Spot Cycle Could Mean ‘Little Ice Age’