
![]()
 relating to the American workforce.
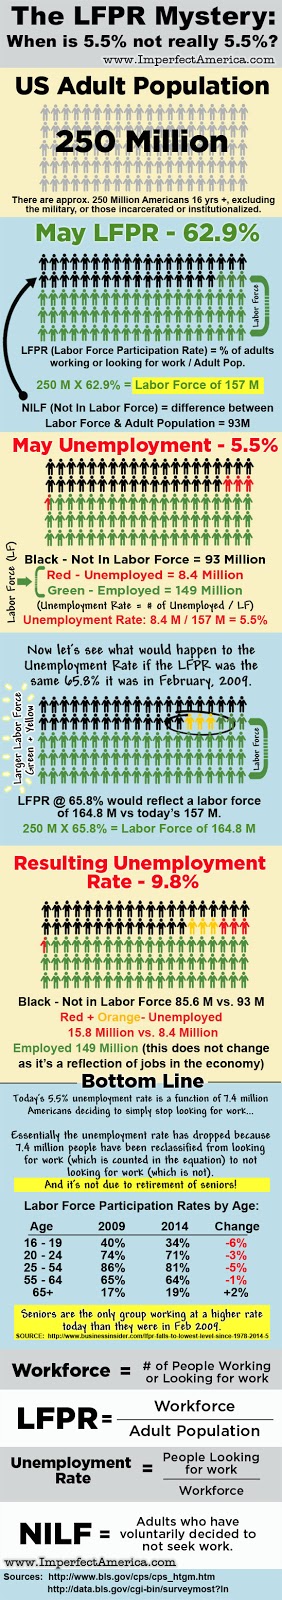
The infographic nearby seeks to clarify the picture somewhat, comparing today’s numbers to those if the LFPR was where it was when Barack Obama took office.
Here are some key numbers from the government:
US Adult Population = 250 Million
(16+ not counting those in the military or imprisoned or institutionalized)
LFPR = 62.9%
(The percentage of the above Adult Population who are in the Labor Force.)
Labor Force – 157 Million
(Those working + those seeking work.)
Employed – 149 Million
(Those currently working.)
Unemployment Rate – 5.5%
(Those not working but seeking work.)
NILF = 93 Million
(Those not in the labor force… not working nor seeking work.)
By comparing today’s LFPR to what it was in February 2009 we can see that the 5.5% unemployment rate is largely an illusion created by a growing number of people becoming discouraged about finding work or who have sufficient benefits from the government that seeking work is no longer a necessity.
And it’s not because of seniors… they are the only demographic who are working at a higher rate today than they were in Feb. 2009.
Here is a link to a large file of the nearby infogpraphic, suitable for printing.
See author page

Vince
You create the best graphics!
Those phony 5.4% months’ rates caused a few discouraged people to try to find jobs in May.
Result?
The unemployment rate ticked up.
Just imagine if ALL of those discouraged workers hit the pavement at once.
The unemployment rate would skyrocket!
Conversely, if everybody just quit working and applied for every gov’t program out there, the unemployment rate would be zero.
Just like what they are doing to the climate numbers and what they plan to do with the way the GDP is calculated, they are tweaking the numbers to present a false narrative in order to prop up the administration. A tactic that was used by the Communists in the old USSR going all the way back to Stalin if not Lenin.
Capitalists are doing quite well Diw has tripled profits are at all time highs
You whiners here sound like a bunch of SOCIALISTS whining about the plight of the workers
Blame the job creators !! They are sure as hell getting richer
Profits have never been higher
Are you suggesting that BUG GIVERNMENT. Should create jobs?
It is true that there are 1 million fewer Americans working for BIG GIVERNMENT Are you suggesting they should be rehired ?
@drjohn: Thanks Dr. John!… and @Nanny G:Nan, you’re right… I should have added that!
Is it difficult for people to grasp the fact that the percentage of the total U.S. population represented by the labor force has declined over the past 6 years because of two entirely predictable shifts in demographics?
3,999,386 million infants were born in the United States during 2010 alone. Let’s pick an annual figure on the low side and multiply: 3.5 million births a year times 6 years equals 21 million additions to those not in the labor force.
On the other end of the age spectrum, the number of the elderly and retired is increasing more rapidly than in the past. People are living longer, and the Baby Boomers are reaching retirement age in increasing numbers. Have we somehow forgotten that this inevitable shift of the ratio between workers and the retired has been a topic of concern and discussion for the past 25 or 30 years? Many more retirees have been added to the ranks of those not in the labor force than has been the case in the past.
No one is falsifying or distorting the numbers. A rising percentage of those not in the workforce is simply built into the nation’s age distribution, and will remain so for at least a decade. The unemployment rate is being computed as it has always been computed; 5.5 percent is the figure that the unaltered arithmetic yields.
Basically, the right wants to discredit the Obama administration’s accomplishments because an election is approaching, and because the GOP hasn’t got a single accomplishment to point to since Obama was elected. That’s no one’s fault but their own. Even with majorities in both houses of Congress going on 6 months, they’re still accomplishing nothing.
There’s a simple, accurate observation that the GOP is going to have to deal with during the run up to the 2016 presidential election: The Bush administration left the U.S. economy in ruins; the Obama administration will be leaving it in far better shape. Nobody with any common sense is going to believe that the real unemployment rate is presently 10 percent. 10 percent was the peak unemployment rate during the recently past Great Recession. An argument that things have not enormously improved since then is absurd.
@Greg:
You continue to use the excuse of:
Perhaps you would like to explain what happened to all those jobs those retirees retired from?
You remain an idiot.
In general, nothing has happened to the jobs that they retired from. The total U.S. population has increased. So has the total number of jobs available—but at a slower pace than population growth.
Obama didn’t cause the nation’s shifting age demographics. Nor can republicans fix the problems that result by lowering rich people’s taxes. Believing that particular claim might serve as a litmus test for genuine stupidity.
@Greg:
You said:
Since 2010 was just 5 years ago, why are you padding your numbers using a 6 year bench mark?
So…….
because you are just a talking parrot for the left wing, let’s look at actual Census Bureau numbers, shall we?
Under 18:
2000 – 72,293,812
2010 – 74,181,467
2013 – 73,585,872 (the number under 18 actually went down in 3 years)
Over 65:
2000 – 34,991,753
2010 – 40,267,984
2013 – 44,704,074
The really big growth:
Age 18-65
2000 – 174,136,341
2010 – 194,296,087
2013 – 197,838,893
So while the population under 18 has grown by 1,292,062 since 2000, and the population over 65 has grown by 9,712,321 since 2000 and you use that as a lame left wing excuse for the low work force percentages under Obama The Job Killer,
the population between 18-65 has actually grown by 23,702,552.
Now, Gullible Greggie, argue with the Census Bureau and make your case that Obama has nothing to do with the low WFPR percentages.
You’re an idiot.
@Greg:
Good to see that you are finally admitting that Obama can’t even keep up with the population growth.
But the small shift in age demographics doesn’t excuse the low LFPR.
Democrats think you can fix the problems by increasing the number of people who pay no taxes but instead live off the taxpayer.
Well, Gullible Greggie, we do have you and you’re an prime example of genuine stupidity.
This is the 2014 USA population ”pyramid.”

Note the end of the ”baby boomers” demographic bump.
Note, also, the fact that people began having fewer children about 49 years ago.
Gee, all that Soviet commie scare of mutually assured destruction sunk in.
20 years ago, that’s 1995 the most recent baby-makers decided to have even fewer babies.
(Global cooling?)
As has been made clear in EVERY thread about Obama’s unemployment woes, the OLDER Americans have been STAYING on their jobs beyond 65, not retiring early or even on time. It is the younger workers who are failing to find full-time careers.
They are the ones with the high unemployment rates when you look at BLS numbers.
This is a chart listing all countries by how many babies each woman has.
IF every woman has 2.1 babies the population rate stays the same….zero growth.
If she has more the population rate grows.
But if she has fewer the population rate shrinks, as the USA’s does since our women average only 2.01 which is too few, requiring immigration just to not shrink our population.
We have over grown our population via legal plus illegal immigration, more than making up for our own women’s lack of babies.
Oddly, or ironically, our immigrants are getting on the dole, despite that being illegal and contrary to our supposed stated goal in importing people!
More people on the dole is no help whatsoever.
That just puts worse tax pressures on those few who are working.
Take a look at GE, making plans to leave liberal Conn., because their taxes are going up too fast and too high.
http://connecticut.news12.com/news/3-major-corporations-threaten-to-leave-ct-1.10497607
We are at that point on the Laffer Curve where there are simply too many in the wagon to be pulled by those trying to keep pulling the wagon.
@retire05, #9:
I’m NOT padding the figure. I chose to use 3.5 million as opposed to the actual 2010 figure of over 3.9 million to avoid any such accusation. How is selecting a lower figure “padding?” 3.5 million per year is conservative. In fact, the figure is downright low. There have been no years since 1979 when there have been so few births in the United States.
I get so weary of the right’s lies and bullshit. Basically, you have a problem with anyone who isn’t stupid enough to swallow it all without questioning it.
@Greg:
21 M would be equal to 3.5 million per year for a full six years. We still have half of 2015 to go.
No, what you get weary of is someone on the right being able to prove that you don’t know your ass from a hole in the ground and showing you up for the uninformed idiot you are who does nothing but spin actual facts to pimp for the left wing.
@Greg: ,
And of course the GOP is not the party that is controlling the government. But note also that the party that is in control, the Dims, hasn’t got a single accomplishment to point to since Obozo was elected.
@Greg: you’re confused. It doesn’t matter if there are 10 million babies a year born… the LFPR has nothing to do with babies or children for that matter. It is a measure of the percentage of adults (16+) who are working or seeking work. If we added 100 million babies in 1 year it wouldn’t matter because children are not part of the equation that determines the LFPR.
Additionally, while seniors are indeed retiring, fewer are doing so now as a percent of the total than were 6 years ago… which explains why 2% more are part of the workforce today than they were in 2009.
@vince: Sad is that no matter how you prove to Greg he is wrong he will either ignore your request for proof or blame Bush!!
@Common Sense: But from another point of view, Greg doesn’t attempt to prove he’s right. He never is. He’s used to it.
@vince, #15:
That millions have been born during the period in question should be sufficient to demonstrate that variables change significantly from one year to the next. Determining an accurate rate for any given year involves a computation using that year’s numbers.
For what purpose? Deception?
The current LFPR cannot be arbitrarily replaced with the 2009 LFBR in order to come up with a “real” current employment rate of 9.8 percent. If it could be, why not just plug in the LFPR for any year that we happen to fancy? We could get a wide range of results by doing so—which, I suppose, would clearly demonstrate that using figures for any year other than the specific year in question yields a meaningless result.
The unemployment figure is 5.5 percent when it is computed using the same formula that has always been used. If the formula is altered from one year to the next, there’s no point ever bothering to compare results. There’s no point even bothering to gather the data and do the arithmetic. You might as well just make figures up.
@Greg:
And oceanfront property in Arizona is still the same price it’s always been.
@Redteam: The government changed the way it calculated the various unemployment rates in 1995 therefore it has NOT always used the same formula.
http://www.bls.gov/opub/mlr/1995/10/art3full.pdf
@another vet: Thanks AV, I knew that. Greg is the one that made the claim in 18 above. I also understand that the price of ocean front property in Arizona has gone up since 95.
@Redteam: I know it wasn’t you who made the erroneous claim. I was offering evidence straight from the BLS itself that supported your position.
@another vet: #20:
I believe the claim of this thread is that the Obama administration has been misrepresenting the unemployment rate. The computational changes you’re referring to actually went into effect in 1994. Here’s a 1995 BLS article that explains the changes.
If you want to nitpick, I’ll reword my statement: The unemployment figure is 5.5 percent when it is computed using the same formula that has been used for the past 20 years. It’s the same formula that was used during every year of the Bush administration; the same formula that was used throughout the last term of the Clinton administration. So, why does it suddenly become a focus of suspicion and accusations all these years later?
I’ll answer that question: Because referring to actual computational changes that most people don’t know much about lends an aura of credibility to the bullshit claim that follows. People are so willing to believe the conclusion that they don’t even think about how ridiculous it is to mix data from periods 6 years apart.
@Greg: Greg, as usual you’re confused. We’re not concerned about the ‘formula’, we’re concerned about the numbers. If the numbers are just changed a little here and there, as they are usually done, it makes a large difference in the result. It’s who controls the numbers, not the formula.
@Redteam:
Exactly.
The number of full time workers in this country is still less than what it was pre-recession despite trillions in deficit spending.
http://research.stlouisfed.org/fred2/data/LNS12500000.txt
The percentage of working age Americans who have jobs is LOWER than what it was during the “Great Recession” and is exactly where it stood when the recession ended six years ago.
http://research.stlouisfed.org/fred2/data/EMRATIO.txt
There are still 6.7 million Americans working part time who want full time work but apparently they don’t matter to the party of the “little guy” so long as the U-3 Unemployment number looks good.
http://www.bls.gov/news.release/empsit.nr0.htm
One would think that if the employment situation was so rosy, we’d see a huge drop in those on food stamps to correspond to all of those high paying jobs, right? Wrong. There are 18 million more Americans on food stamps now than there were during the “Great Recession” and 13 million more than there were the year it ended. Those numbers should be reversed.
http://www.fns.usda.gov/sites/default/files/pd/SNAPsummary.pdf
The debt to GDP ratio has increased significantly as well.
http://www.tradingeconomics.com/united-states/government-debt-to-gdp
And six years into a “recovery”, and a “great” one as alleged by the sheep, we just had our third quarter of contraction. But they’ll be changing the way the GDP numbers are calculated this summer to make sure that those jive with their narrative that we are just humming along.
Only a hardcore leftist would be happy with all of this and defend it. After all, government dependency, and more importantly government control, are what it’s all about.
@another vet, #25:
It’s certainly no less than the average for the years immediately preceding the recession. There was only a 5-month period—from 11/2007 to 03/2008—that was marginally higher than the current level of 121,402 thousand:
2007-11-01 121875
2007-12-01 121609
2008-01-01 121435
2008-02-01 121474
2008-03-01 121426
Were it not for that brief period before the entire credit-and-deficit-fueled binge went bust, the current number employed would be the highest in U.S. history.
It’s not as if that reflects the situation at the end of the Bush administration, either. The bust didn’t happen on Obama’s watch. What he found waiting for him when in took office in January 2008 was this number:
2009-01-01 115818
Obama inherited an economy that might be described as the aftermath of a train wreck, were it not for the fact that the wreck was still in progress and the damage was still piling up. He wasn’t faced only with the need for policies that would encourage recovery. First he had to brake the momentum of the train. For a few months, collapse of the world economy into a prolonged global depression looked like a very real possibility. Have people somehow forgotten that?