
![]()
The blogger who started the whole shabang rolling on the story of bad temperature date, Steve McIntyre, which resulted in the hottest year on record changing from the mid 90’s to mid 30’s has put up another great post about all the controversy:
There’s been quite a bit of publicity about Hansen’s Y2K error and the change in the U.S. leaderboard (by which 1934 is the new warmest U.S. year) in the right-wing blogosphere. In contrast, realclimate has dismissed it a triviality and the climate blogosphere is doing its best to ignore the matter entirely.
My own view has been that matter is certainly not the triviality that Gavin Schmidt would have you believe, but neither is it any magic bullet. I think that the point is significant for reasons that have mostly eluded commentators on both sides.
First, let’s start with the impact of Hansen’s error on individual station histories, GISS provides an excellent and popular online service for plotting temperature histories of individual stations. Many such histories have been posted up in connection with the ongoing examination of surface station quality at surfacestations.org.But it’s presumably not just Anthony Watts and surfacestations.org readers that have used these GISS station plots; presumably scientists and other members of the public have used this GISS information. The Hansen error is far from trivial at the level of individual stations. Grand Canyon was one of the stations previously discussed at climateaudit.org in connection with Tucson urban heat island. In this case, the Hansen error was about 0.5 deg C. Some discrepancies are 1 deg C or higher.
~~~GISS recognized that the error had a significant impact on individual stations and took rapid steps to revise their station data (and indeed the form of their revision seems far from ideal indicating the haste of their revision.) GISS failed to provide any explicit notice or warning on their station data webpage that the data had been changed, or an explicit notice to users who had downloaded data or graphs in the past that there had been significant changes to many U.S. series. This obligation existed regardless of any impact on world totals.
GISS has emphasized recently that the U.S. constitutes only 2% of global land surface, arguing that the impact of the error is negligible on the global averagel. While this may be so for users of the GISS global average, U.S. HCN stations constitute about 50% of active (with values in 2004 or later) stations in the GISS network. The sharp downward step in station counts after March 2006 in the right panel shows the last month in which USHCN data is presently included in the GISS system. The Hansen error affects all the USHCN stations and, to the extent that users of the GISS system are interested in individual stations, the number of affected stations is far from insignificant, regardless of the impact on global averages.
~~~
The Hansen error also has a significant impact on the GISS estimate of U.S. temperature history with estimates for 2000 and later being lowered by about 0.15 deg C (2006 by 0.10 deg C). Again GISS moved quickly to revise their online information changing their US temperature data on Aug 7, 2007. Even though Gavin Schmidt of GISS and realclimate said that changes of 0.1 deg C in individual years were “significant”, GISS did not explicitly announce these changes or alert readers that a “significant” change had occurred for values from 2000-2006.
~~~
In addition, while Schmidt describes the changes atop the leader board as “very minor re-arrangements”, many followers of the climate debate are aware of intense battles over 0.1 or 0.2 degree (consider the satellite battles.) Readers might perform a little thought experiment: suppose that Spencer and Christy had published a temperature history in which they claimed that 1934 was the warmest U.S. year on record and then it turned out that they had been a computer programming error opposite to the one that Hansen made, that Wentz and Mears discovered there was an error of 0.15 deg C in the Spencer and Christy results and, after fiixing this error, it turned out that 2006 was the warmest year on record. Would realclimate simply describe this as a “very minor re-arrangement”?
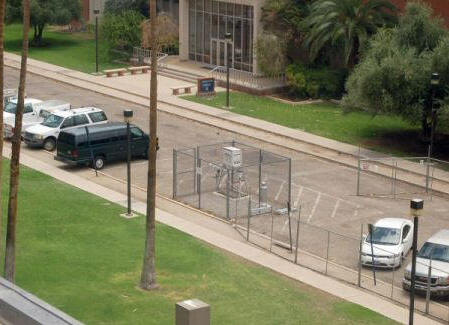
~~~Now my original interest in GISS adjustments did not arise abstractly, but in the context of surface station quality. Climatological stations are supposed to meet a variety of quality standards, including the relatively undemanding requirement of being 100 feet (30 meters) from paved surfaces. Anthony Watts and volunteers of surfacestations.org have documented one defective site after another, including a weather station in a parking lot at the University of Arizona where MBH coauthor Malcolm Hughes is employed, shown below.
Figure 5. Tucson University of Arizona Weather StationThese revelations resulted in a variety of aggressive counter-attacks in the climate blogosphere, many of which argued that, while these individual sites may be contaminated, the “expert” software at GISS and NOAA could fix these problems, as, for example here .
they [NOAA and/or GISS] can “fix” the problem with math and adjustments to the temperature record.
This assumes that contaminating influences can’t be and aren’t being removed analytically.. I haven’t seen anyone saying such influences shouldn’t be removed from the analysis. However I do see professionals saying “we’ve done it”
“Fixing” bad data with software is by no means an easy thing to do (as witness Mann’s unreported modification of principal components methodology on tree ring networks.) The GISS adjustment schemes (despite protestations from Schmidt that they are “clearly outlined”) are not at all easy to replicate using the existing opaque descriptions.
~~~
Schmidt observed that the U.S. accounts for only 2% of the world’s land surface and that the correction of this error in the U.S. has “minimal impact on the world data”, which he illustrated by comparing the U.S. index to the global index. I’ve re-plotted this from original data on a common scale. Even without the recent changes, the U.S. history contrasts with the global history: the U.S. history has a rather minimal trend if any since the 1930s, while the ROW has a very pronounced trend since the 1930s.
These differences are attributed to “regional” differences and it is quite possible that this is a complete explanation. However, this conclusion is complicated by a number of important methodological differences between the U.S. and the ROW. In the U.S., despite the criticisms being rendered at surfacestations.org, there are many rural stations that have been in existence over a relatively long period of time; while one may cavil at how NOAA and/or GISS have carried out adjustments, they have collected metadata for many stations and made a concerted effort to adjust for such metadata. On the other hand, many of the stations in China, Indonesia, Brazil and elsewhere are in urban areas (such as Shanghai or Beijing). In some of the major indexes (CRU,NOAA), there appears to be no attempt whatever to adjust for urbanization. GISS does report an effort to adjust for urbanization in some cases, but their ability to do so depends on the existence of nearby rural stations, which are not always available. Thus, there is a real concern that the need for urban adjustment is most severe in the very areas where adjustments are either not made or not accurately made.
In its consideration of possible urbanization and/or microsite effects, IPCC has taken the position that urban effects are negligible, relying on a very few studies (Jones et al 1990, Peterson et al 2003, Parker 2005, 2006), each of which has been discussed at length at this site. In my opinion, none of these studies can be relied on for concluding that urbanization impacts have been avoided in the ROW sites contributing to the overall history.
One more story to conclude. Non-compliant surface stations were reported in the formal academic literature by Pielke and Davey (2005) who described a number of non-compliant sites in eastern Colorado. In NOAA’s official response to this criticism, Vose et al (2005) said in effect –
it doesn’t matter. It’s only eastern Colorado. You haven’t proved that there are problems anywhere else in the United States.
In most businesses, the identification of glaring problems, even in a restricted region like eastern Colorado, would prompt an immediate evaluation to ensure that problems did not actually exist. However, that does not appear to have taken place and matters rested until Anthony Watts and the volunteers at surfacestations.org launched a concerted effort to evaluate stations in other parts of the country and determined that the problems were not only just as bad as eastern Colorado, but in some cases were much worse.
Now in response to problems with both station quality and adjustment software, Schmidt and Hansen say in effect, as NOAA did before them –
it doesn’t matter. It’s only the United States. You haven’t proved that there are problems anywhere else in the world.
It’s a little disturbing that GISS was "fixing bad data," how in the world is this possible? I will not pretend to be a climate scientist but I would think that bad data is bad data. You could adjust it whichever way you want but it won’t make it a true result.
Steven goes out of his way to write a detailed answer back to this critics but it all boils down to the fact that the Goracle crowd dismisses anything that disagrees with them as insignificant or wrong. They tell you that the debate is over but when you point out the many scientists who disagree with them they tell you that the number of scientists who disagree are insignificant. You point them to thousands of scientists and they tell you they are not the right scientists. You point them to a few thousand of the "right" scientists and they tell you "well, they all haven’t written papers." You see where I’m going?
Now that there is evidence that an important data error was fixed quietly and secretly, and only found because of a few stubborn bloggers, they call the error insignificant.
But of course this is all mute, the debate is over…..
UPDATE
Look at some examples of questionable placement of weather stations:
Forest Grove, OR (air conditioner exhaust blowing directly on temperature shelter, nearby asphalt and buildings)
More photos: http://gallery.surfacestations.org/main.php?g2_itemId=1493
Marysville, CA (close by parking, air conditioners blowing exhaust near MMTS temp sensor, BBQ used by firefighters, cell phone tower base)
More photos: http://gallery.surfacestations.org/main.php?g2_itemId=660
Tahoe City, CA (burn barrel, close by parking, tennis court surface 25 feet away built in early 1980’s)
More photos: http://gallery.surfacestations.org/main.php?g2_itemId=694
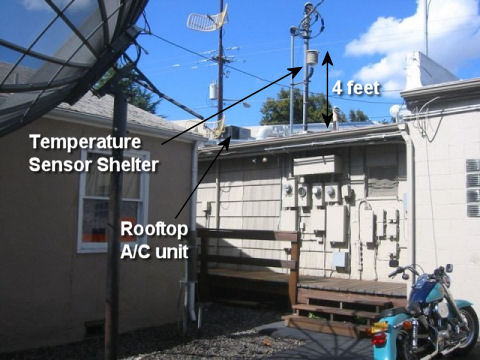
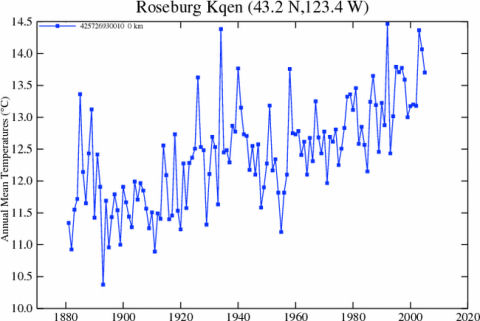
Roseburg, OR (MMTS shelter on roof, near a/c exhaust)
More photos: http://gallery.surfacestations.org/main.php?g2_itemId=1535
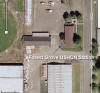
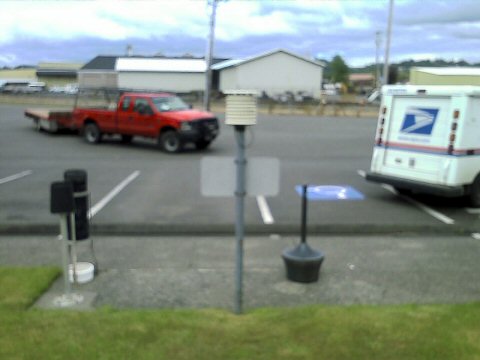
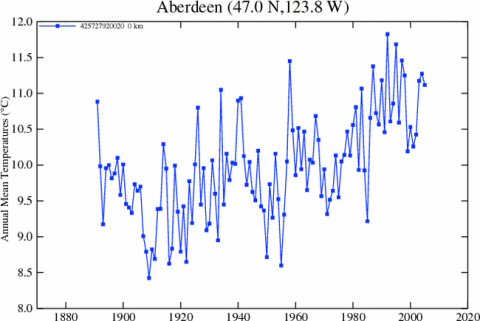
Aberdeen, WA ( large heat source: sewage treatment plant – nearby parking, hot automobile radiators )
More photos here: http://gallery.surfacestations.org/main.php?g2_itemId=4658
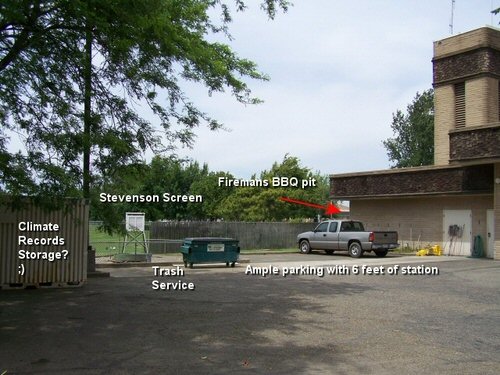
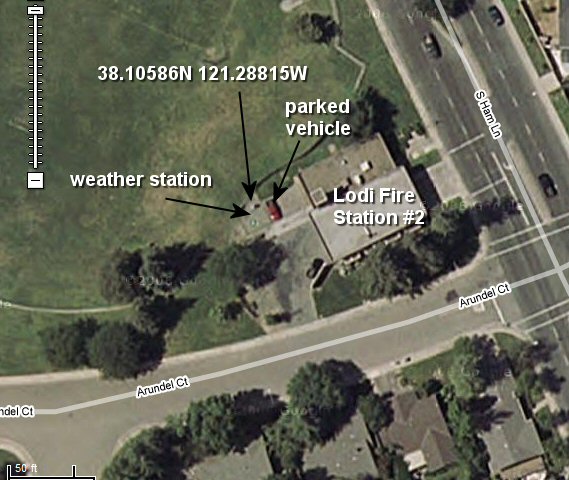
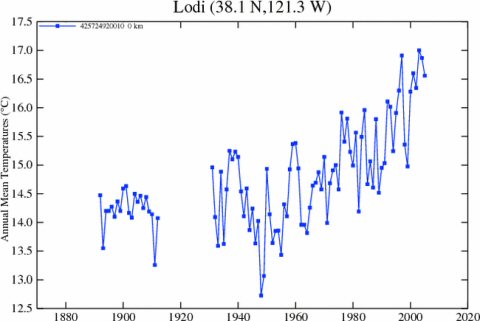
Lodi, CA (nearby parking, asphalt, dumpster, nearby building, storage container)
More photos: http://gallery.surfacestations.org/main.php?g2_itemId=658
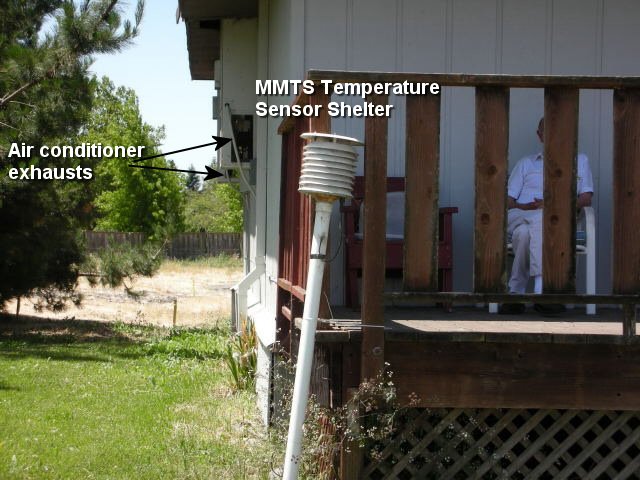
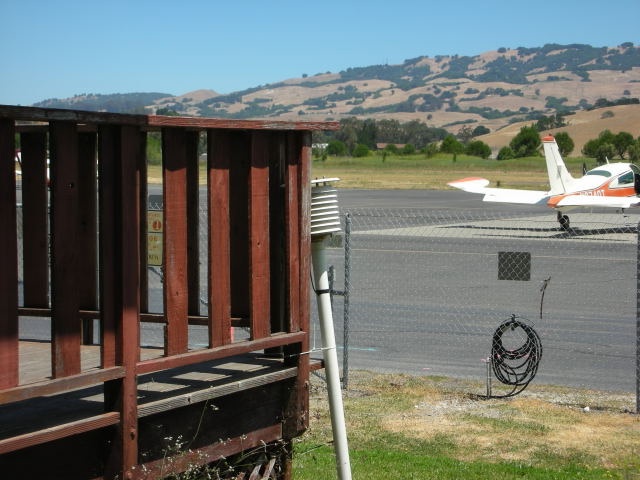
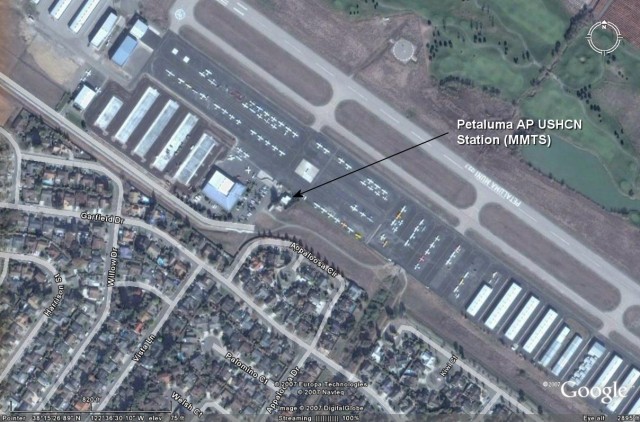
Petaluma, CA (a/c units nearby, MMTS strapped to deck, 6′ from building, lots of nearby tarmac, prevailing wind UHI effect from SW)
More photos: http://gallery.surfacestations.org/main.php?g2_itemId=680
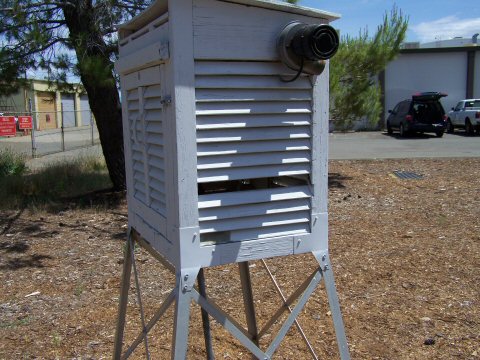
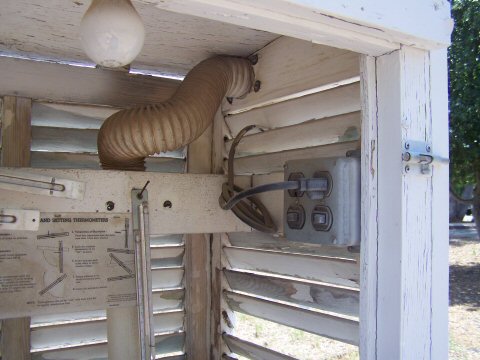
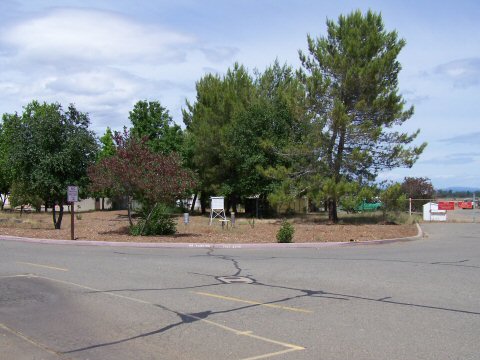
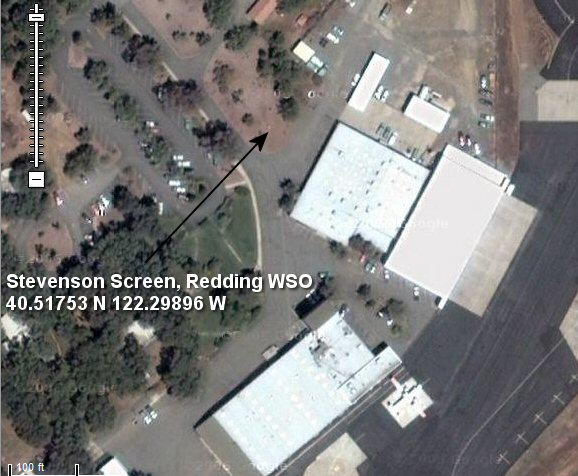
Redding, CA (lightbulb in temperature shelter, nearby asphalt and buildings, lots of airport tarmac)
More photos: http://gallery.surfacestations.org/main.php?g2_itemId=682
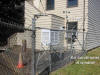
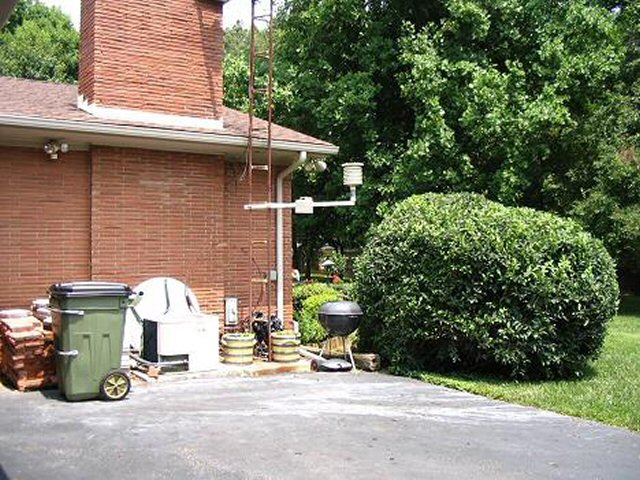
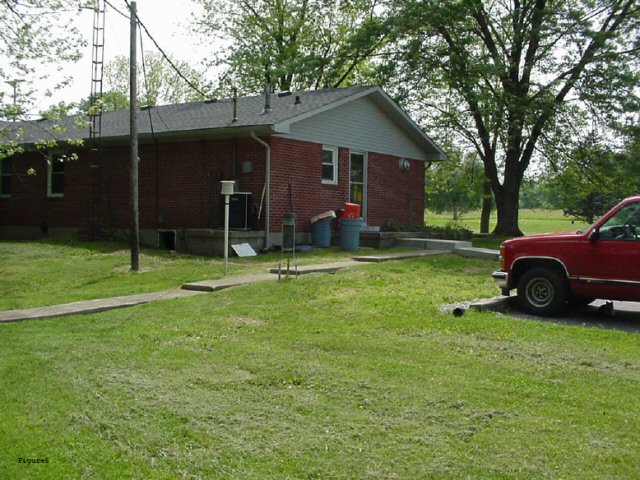
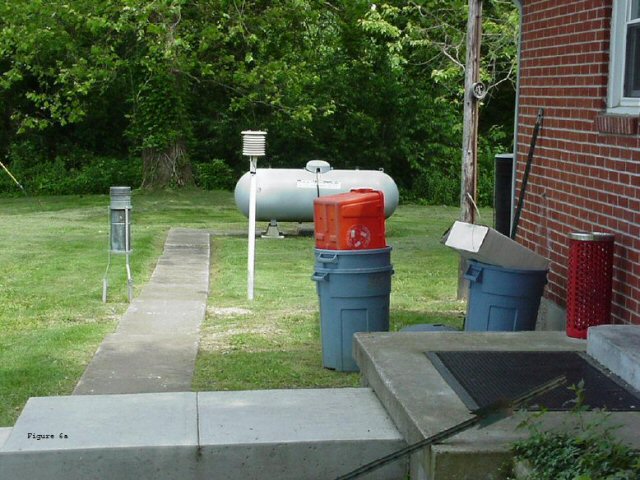
Hopkinsville, KY Picture at left is most current, others are from years ago. (MMTS sensor close to house, with air conditioning unit nearby, close-by parking, and near new fireplace chimney built into rear wall. Note BBQ also.)


See author page

GIGO
Trackbacked by The Thunder Run – Web Reconnaissance for 08/13/2007
A short recon of what’s out there that might draw your attention, updated throughout the day…so check back often.